Probability Tree Diagrams: Branching Out into Better Math Thinking
If you’ve ever taught probability to middle school or Algebra 1 students, you know the look—
the “Wait… so the coin flips twice?” face.
The “Do I multiply? Add? Puzzled?” face.
Lucky for all of us, math teachers are professional confusion-untanglers. And when the probability jungle gets dense, nothing clears a path faster than a Probability Tree Diagram.
Tree diagrams don’t just organize outcomes—they help students see the structure of probability instead of trying to hold 87 possibilities in their heads at once. It’s like giving them a GPS when they were previously wandering through the forest with a blindfold and a granola bar.
🍃 Why Tree Diagrams Make Life Easier
Tree diagrams are the Swiss Army knife of probability tools, because they help students:
Map out each event step-by-step
Visualize all possible outcomes
Understand compound events without guesswork
🌳 Common Student Struggles (and How Tree Diagrams Fix Them)
1. Getting Lost in Multi-Step Events
Ask students what happens if you roll a die then flip a coin, and you’ll watch them spiral.
Tree diagrams visually unfold each event one branch at a time—problem solved.
2. Forgetting When to Multiply vs. Add
Students often think math probability rules are a mood.
Tree diagrams keep operations structured:
Multiply along branches
Add across branches
Boom. Predictability restored.
3. Missing Outcomes
Probability questions fall apart when kids forget, you know… 40% of the outcomes.
Tree diagrams force all outcomes to appear.
4. Visual Learners Need… Visuals
Numbers alone aren’t enough for many students.
Tree diagrams make probability concrete, accessible, and way less intimidating.
🍀 Fun Classroom Ideas to Make Tree Diagrams Stick
🍬 1. Candy Scenario Breakers
“Oh no, the gummy bear bag spilled! What are the chances you pick green then red?”
Instant engagement.
Low prep.
Maximum math drama.
🧪 2. Probability Labs
Set up quick stations: colored chips, dice, and spinners.
Have students predict using a tree diagram before experimenting.
They love checking if the math matches the chaos.
🎭 3. “Choose Your Adventure” Problems
Students write a short scenario with branching choices.
Then they map the outcomes with a tree diagram.
Creativity + math = Math Magic
🌈 Why Tree Diagrams Are a Teacher’s Best Friend
They work across:
Probability
Logic
Counting principles
Games and real-world scenarios
Review activities
State test prep
And your students’ general sense of mathematical peace
Plus—they’re just plain satisfying to draw.
If bullet journaling and algebra had a baby, it would be a tree diagram.
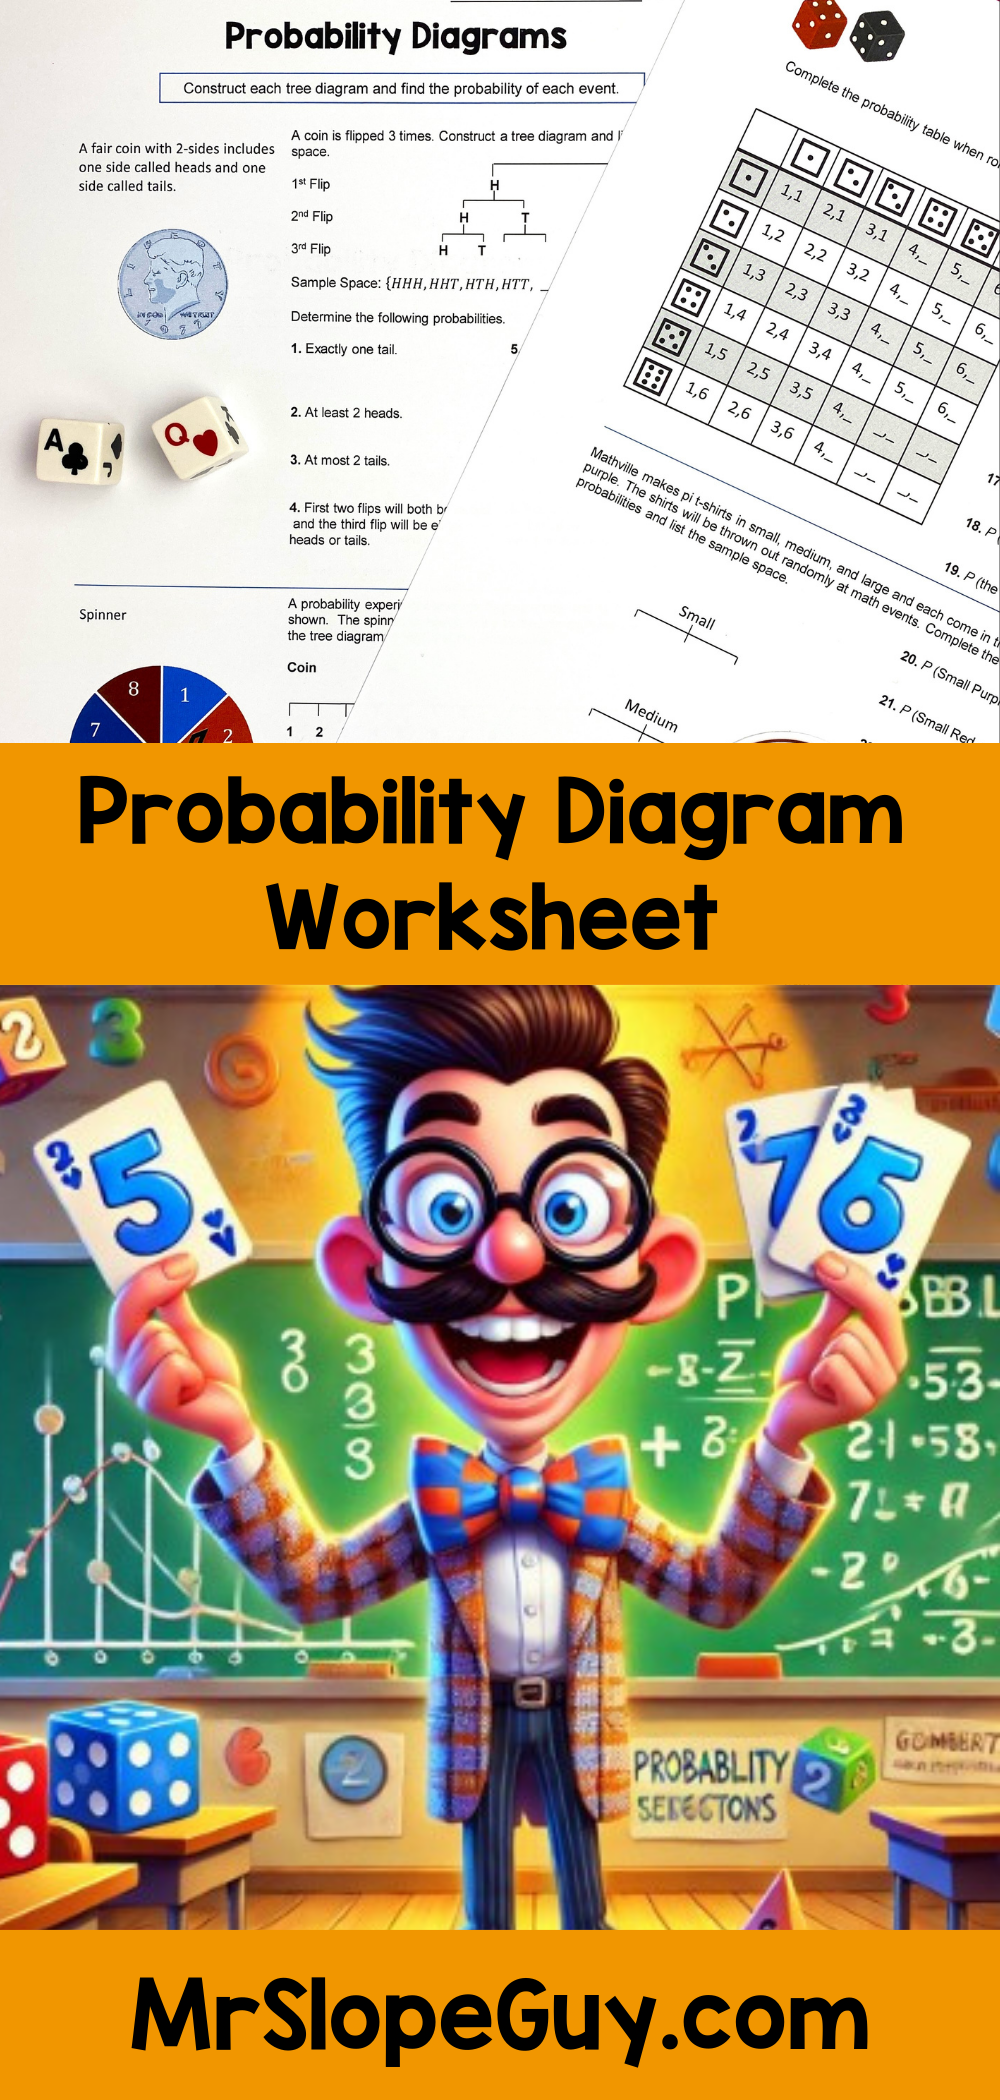
🌟 Ready-to-Use Probability Tree Diagram Practice
If you want a print-and-go resource that walks students from foundations to mastery, check out my:
👉 Probability Tree Diagrams Worksheet – Printable Activity
Perfect for middle school and Algebra 1. Includes structured scaffolding, clear diagrams, and real-world style problems