Graphing Stories: Once Upon a Time in Algebra
“Once upon a time,” a phrase we usually associate with fairy tales, actually has a surprising place in the math classroom. When we teach students about functions and graphing stories, we are really helping them see how a story unfolds mathematically. Every fairy tale has a beginning, middle, and end—and so does every graph. But teaching this skill can be surprisingly tricky.
The Struggles of Teaching Graphing Stories
For many middle school and Algebra 1 students, graphing stories can feel like a puzzle with missing pieces. They’re asked to imagine a situation, translate it into a graph, and then interpret what that graph means. This skill goes far beyond just plotting points—it’s about connecting real-world scenarios to mathematical models.
Here are a few common struggles:
Too Literal Thinking – Some students want the graph to “look like” the object in the story. For example, if the problem is about a roller coaster, they’ll try to draw loops instead of focusing on how height changes over time.
Forgetting the Variables – Students sometimes lose sight of what’s being measured. If the x-axis is time and the y-axis is height, they might accidentally graph speed or distance instead.
Flat vs. Changing Graphs – When asked to graph something staying the same, students often create a slanted line because they feel every graph “has to move.” Recognizing when to draw a flat line to represent staying constant, a horizontal line is an important breakthrough.
Interpreting Rates of Change – It’s not always obvious when a slope should be steep or shallow increasing or decreasing. Students struggle to show the difference between something that changes quickly and something that changes slowly.
Making the Story-to-Math Leap – Ultimately, students must translate words into visuals. For some, that step feels like crossing a rickety bridge between Language Arts class and math class.
Fairy Tales on the Graph
One fun way to make graphing stories more engaging is to connect them to characters the students already know—like The Three Little Pigs.
Imagine graphing the stability of each pig’s house over time in strong winds:
The straw house – At first, the house stands tall. But the moment the wind howls, the graph drops quickly to zero, representing its collapse.
The stick house – Stronger than straw, it holds for a bit longer. The graph stays steady for a while before falling more gradually.
The brick house – Built to last, this graph remains strong and flat, showing no change in stability despite the wolf’s best efforts.
By connecting the pigs’ story to the concept of graphing situations, students begin to see that graphs don’t just show numbers—they tell a narrative.

Mr. Slope Guy hanging out with the Three Little Pigs in Tampa, Florida with some of Fairy Land’s Survivors—proving that even fairy tales can inspire great graphing stories!
Why Graphing Stories Matter
Mastering graphing stories gives students more than just practice with lines and curves—it builds the foundation for understanding functions. Students learn that:
Graphs are visual representations of relationships.
The slope and shape of a graph convey change over time.
Real-life situations—whether it’s a pig’s house in the wind, water filling a bathtub, or a car slowing down—can all be modeled mathematically.
When students can move fluidly between words, stories, and graphs, they unlock the ability to interpret data and predict outcomes.
A Classroom Solution
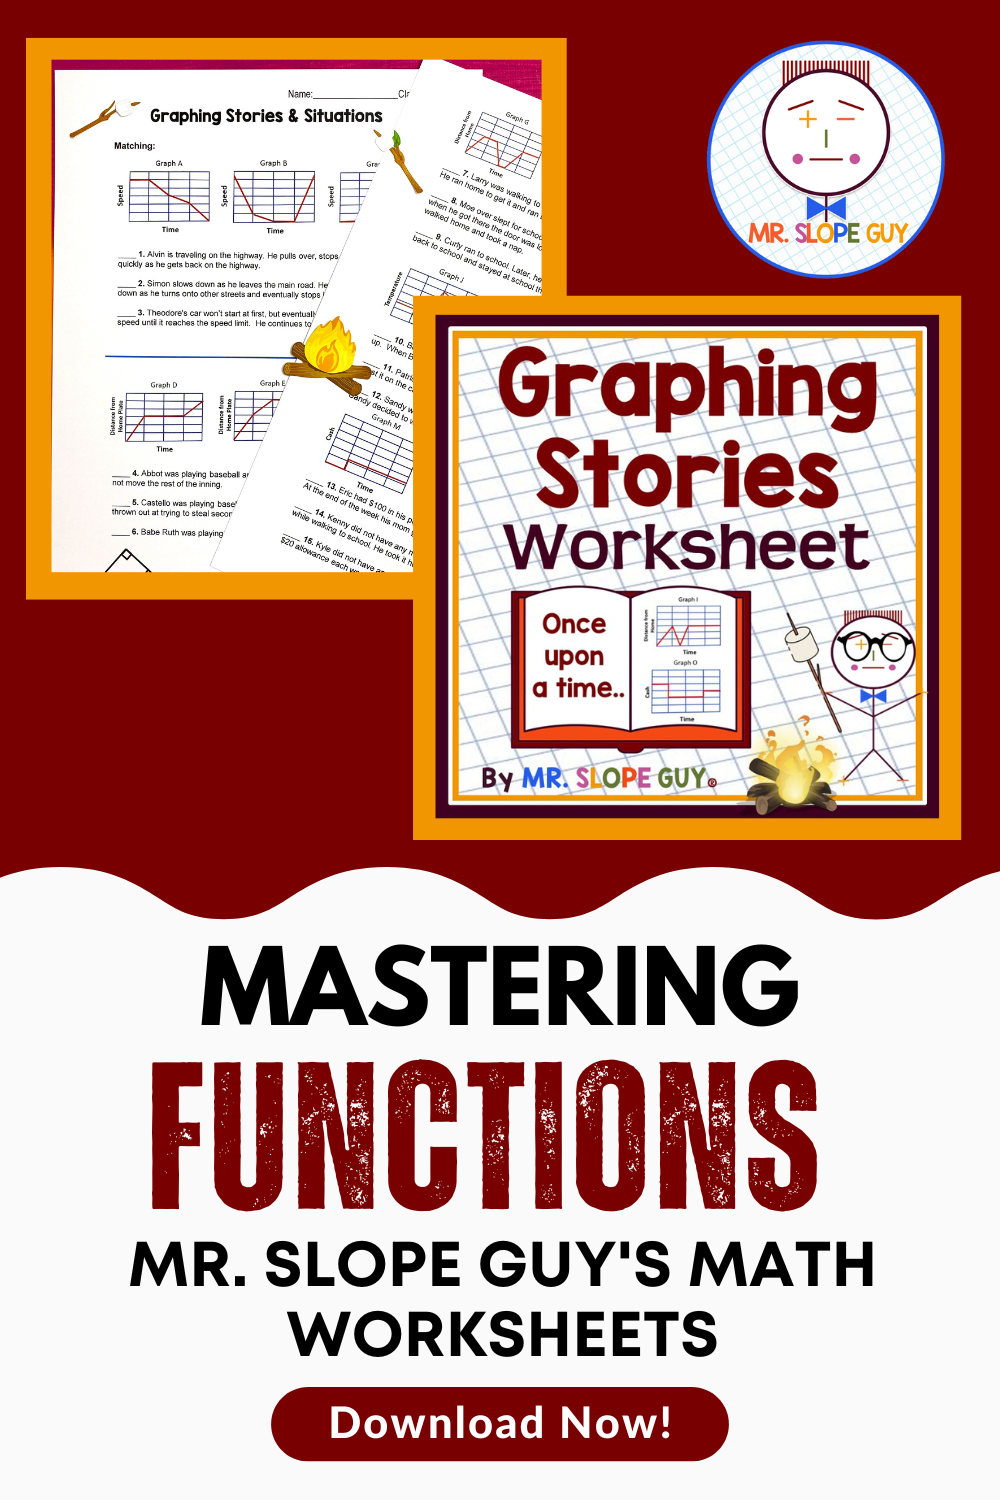
If your students could use some guided practice with graphing stories, I’ve created a resource that does just that.
👉 Check out my Graphing Stories and Situations Worksheet Activity on Teachers Pay Teachers. This engaging activity helps students connect everyday scenarios to graphs, making the abstract concrete. It’s no-prep, classroom-tested, and a perfect way to strengthen understanding of functions.