Comparing Rates of Change of Linear Functions: Sledding Into Slope Success
If you’ve ever watched kids race sleds down a snowy hill, you’ve already seen rates of change in action.
Some sleds fly down the mountain at lightning speed. Others glide slowly, and a few get stuck halfway while their riders wonder what went wrong. In math class, comparing rates of change works the same way—except instead of snow and sleds, we use tables, equations, and graphs to figure out which line is moving faster.
Today we’re heading downhill into one of the most important algebra skills: comparing rates of change of linear functions.
🎿 What Is a Rate of Change?
Rate of change tells us how quickly one quantity changes compared to another.
In linear functions, the rate of change is the slope.
Think of slope like a mountain:
A steeper slope = faster sled ride
A gentle slope = slower movement
A negative slope = sledding downhill
A positive slope = climbing uphill (not as fun!)
Students often understand slope on a graph, but the challenge comes when they have to compare slope across different representations.
🧊 Comparing Rate of Change from Tables
🧠 Teaching tip:
Have students look for “how much y changes” each step. It’s like measuring how far the sled travels each second.
Many students get confused if they see more than two points when finding slope. Just use two points in the slope formula or make a graph.
📈 Comparing Rate of Change from Graphs
Graphs bring the visual power.
When students see two lines on the same coordinate plane, ask:
Which line is steeper?
Which line rises faster?
Which sled would win the race?
A line that climbs quickly left to right has a larger positive slope. A downward slope means the sled is heading downhill.
Students love the sledding analogy because they instantly understand:
Steeper mountain = faster change.
Greater absolute value is key to the actual greatest slope.
📐 Comparing Rate of Change from Equations
Here’s where things get interesting.
Slope-Intercept Form:
y= mx + b
This one is easy—the slope is m.
Example:
y = 3x + 2 → slope = 3
y = -1x + 5 → slope = -1
No snow gear required.
Standard Form:
Ax + By = C
Now students have to work a little harder.
Example:
2x + y = 6
Solve for y:
y = -2x + 6
Now the slope is visible: -2.
🧠 Teaching tip:
Remind students that standard form hides the slope like a sled buried in snow—they have to uncover it first.
🏔 Why Comparing Rates of Change Matters
Students often see slope as just another number to calculate, but comparing rates of change helps them:
Understand real-world situations
Interpret graphs quickly
Connect tables, equations, and visuals
Prepare for functions, systems, and word problems
It also develops flexible thinking:
The same slope can appear in three different forms—and students should recognize it every time.
❄️ Common Student Struggles
Here’s where things can get slippery:
Forgetting to divide change in y by change in x
Mixing up rise/run
Thinking steeper always means larger (negative slopes!)
Not recognizing slope hidden in standard form
Comparing numbers without context
The key? Lots of structured practice using all representations together.
🛷 Bringing It All Together
When students can compare rates of change from:
✔ Tables
✔ Graphs
✔ Equations (both slope-intercept and standard form)
…they’re no longer just calculating slope—they’re understanding linear relationships deeply.
It’s like moving from riding the bunny hill to confidently flying down the mountain.
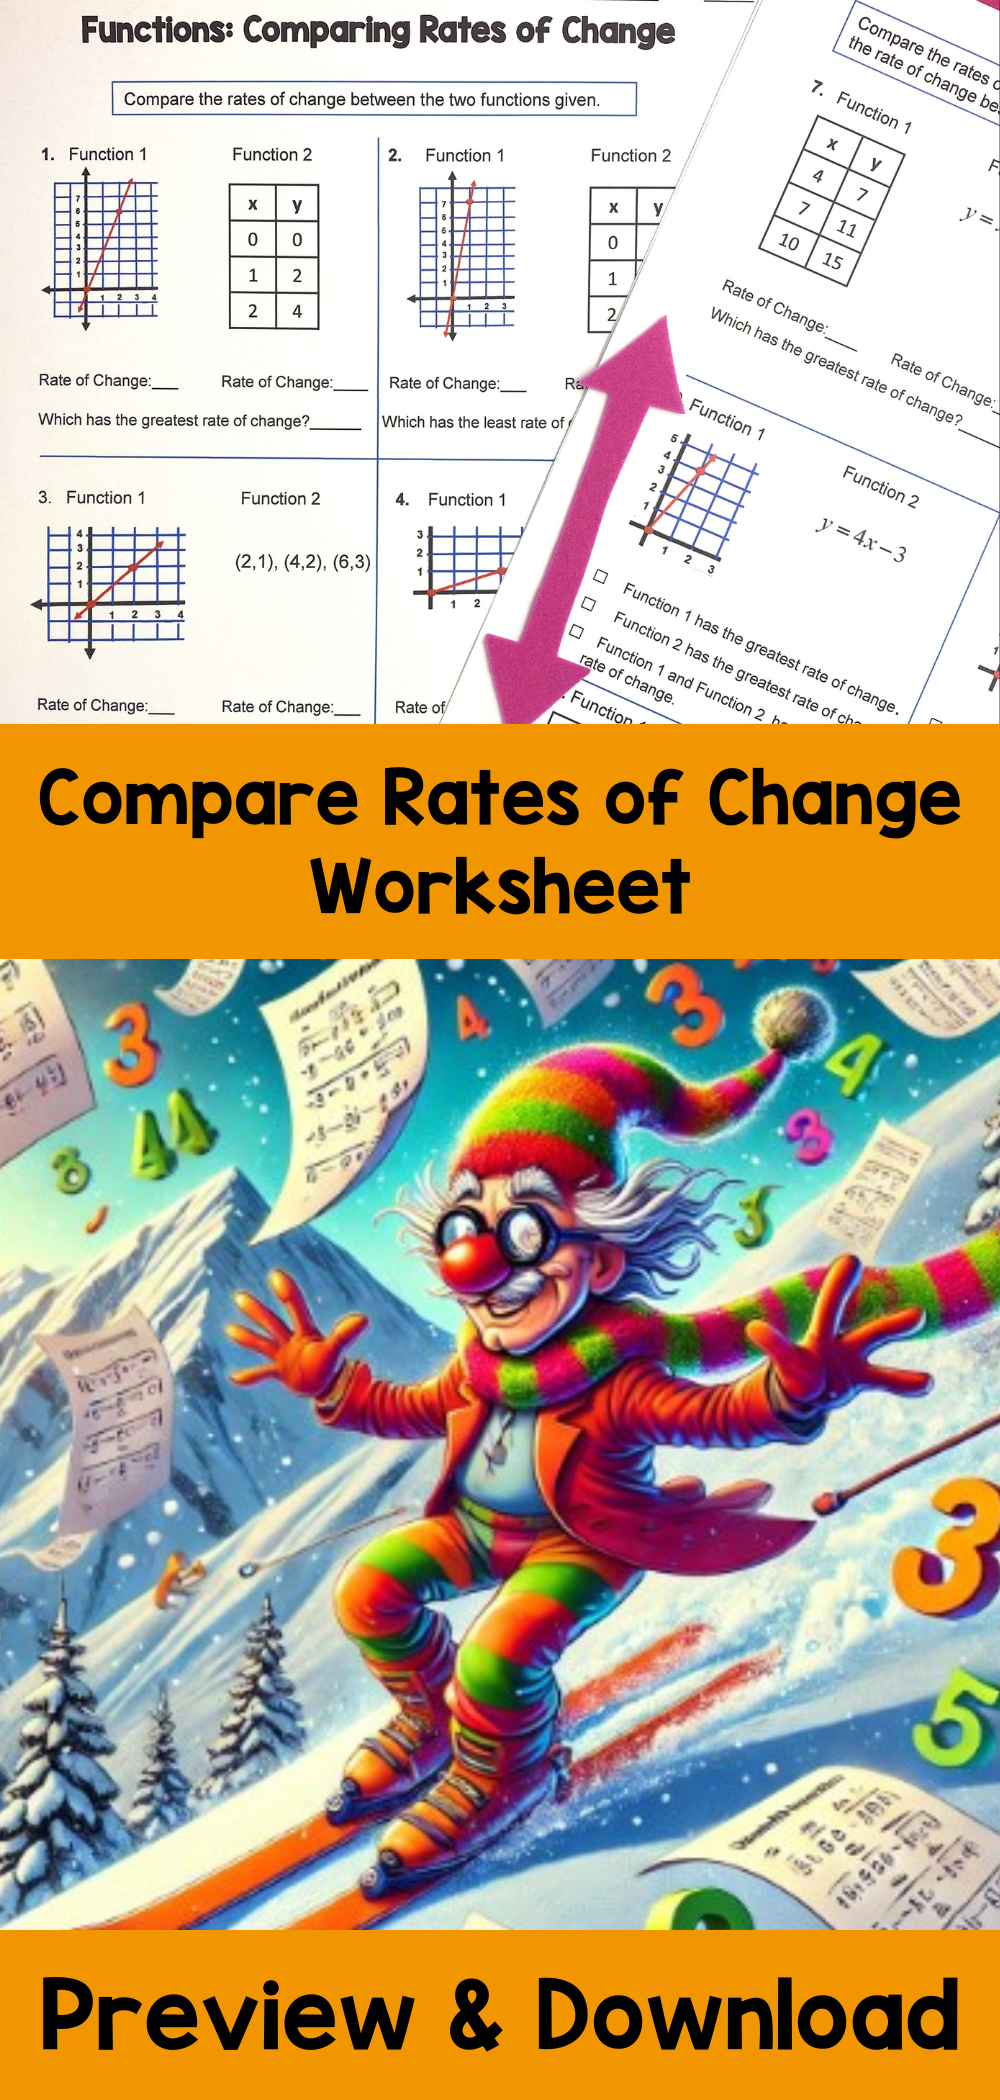
🎯 Ready-to-Go Practice for Your Classroom
If you want students to build real confidence comparing rates of change, check out this classroom-tested resource:
👉 Finding and Comparing Rates of Change as Slope Worksheet
Why Teachers Love It:
Practice comparing slope from tables, graphs, and equations
Clear structure that builds understanding step-by-step
Great for middle school and Algebra 1
Printable, no-prep, and easy to grade
Perfect for review, homework, or small group work
Help your students sled smoothly from confusion to confidence—one slope at a time. 🛷📈